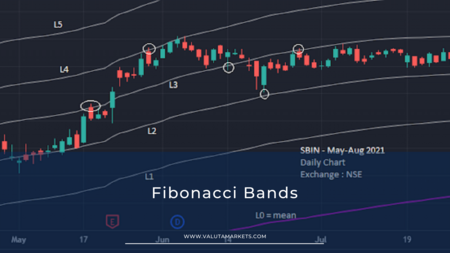
Leonardo Fibonacci, a thirteenth-century Italian mathematician, is credited with discovering the Fibonacci sequence, which underpins this technical analysis tool. So what are Fibonacci Bands? Fibonacci Bands are a technical analysis tool used by traders to measure price volatility. The bands are created by plotting two lines, an upper and lower band, around the moving average of the price. The width of the bands is determined by the standard deviation of the prices over a given period of time.
How Does Fibonacci work?
A series of numbers in which each subsequent number is the sum of the two preceding numbers, that’s the Fibonacci sequence. The Fibonacci sequence starts with 0 and 1, and the next number in the sequence is always the sum of the previous two. An example is 0, 1, 1, 2, 3, 5, 8, 13, 21, 34,….
The Fibonacci sequence can be applied to trading in a number of ways. The most common is to use Fibonacci retracements. In trading, Fibonacci retracement is a method of technical analysis for determining support and resistance levels. The theory is that after an asset price makes a large move in either direction, it will retrace or reverse by a certain percentage before continuing in the original direction.
The Fibonacci sequence can be applied to price action in order to identify potential support and resistance levels. These levels are found by first identifying the major high and low in the recent past and then drawing a horizontal line between them. The next step is to find the Fibonacci ratios of 23.6%, 38.2%, and 61.8% between the high and low and mark these horizontal lines on the chart.
These Fibonacci levels can be used as potential support and resistance levels. If the price action is above the 23.6% level, this could be seen as a sign that the uptrend is still intact and that the 38.2% and 61.8% levels could act as potential support levels. Conversely, if the price action is below the 23.6% level, this could be seen as a sign that the downtrend is still intact and that the 38.2% and 61.8% levels could act as potential resistance levels.
The Pros and cons of Using Fibonacci Bands
When it comes to trading, there is no holy grail or one perfect indicator that will always give you the right signal at the right time.
Fibonacci Bands can be a helpful tool for traders to measure price volatility and identify potential support and resistance levels, but they should not be used in isolation. It is always important to use multiple indicators and do your own research before making any trading decisions.
Here are some of the pros and cons of using Fibonacci Bands:
Pros
- Can help identify potential support and resistance levels
- Can help measure price volatility
- Can be used in conjunction with other technical analysis tools
Cons
- Will not always give you the right signal at the right time
- Should not be used in isolation
Tips for Trading with Fibonacci Bands
If you are thinking about incorporating Fibonacci Bands into your trading strategy, here are a few tips to keep in mind:
- Do your own research and don’t rely solely on the signals generated by Fibonacci Bands
- Be aware of the potential for false signals
- Remember that Fibonacci Bands are just one tool that can be used to measure price volatility and identify potential support and resistance levels. They should not be used in isolation.
Frequently Asked Questions
Q: What is the Fibonacci golden ratio?
A: A Fibonacci golden ratio is a number that is often used in technical analysis. It is calculated by taking the Fibonacci sequence and dividing the number that comes after it by the number that comes before it. 1.618 is the most commonly used Fibonacci golden ratio.
Q: What is the Fibonacci sequence?
A: The Fibonacci sequence is a series of numbers where each number is the sum of the previous two.
Q: What are Fibonacci levels?
A: Fibonacci levels are horizontal lines that are plotted at certain Fibonacci ratios above and below a major high or low. These levels can be used as potential support and resistance levels.
Q: How do I use Fibonacci retracement?
A: A technique for determining probable support and resistance levels in technical analysis is what is known as a Fibonacci retracement. To do this, you first need to identify the major high and low and then draw a horizontal line between them. Next, you will find the Fibonacci ratios of 23.6%, followed by 38.2% and 61.8% between the high and low, and mark these horizontal lines on the chart. These Fibonacci levels can be used as potential support and resistance levels.
Bottom Line
Fibonacci ratios and retracements have proved to be popular tools among technical traders. Although Fibonacci Bands will not always give you the right signal at the right time, they can be used in conjunction with other technical analysis tools to help you make more informed trading decisions. It is always important to do your own research and to use multiple indicators before making any trading decisions.