As an active trader, you have probably noticed that asset prices follow particular patterns. A consistently occurring pattern consolidates price changes. Usually, financial assets trade within a tight range, consolidate a recent move, moving to a different range before they repeat the entire process. Even in ongoing market trends, asset prices usually target certain levels before moving to the next level.
One of the best ways for a trader to predict these price targets is using a Fibonacci indicator. You can use Fibonacci retracement analysis to take a profit, confirm an entry-level, and determine the stop-loss level. It works because traders can use the indicator to identify and place their trades in solid long-term price trends. This is done by determining the point at which an asset’s price is likely to change course.
Fibonacci retracements can be applied to various timeframes. They are more effective on longer timeframes, for instance, on a weekly chart, than on a 1-hour chart.
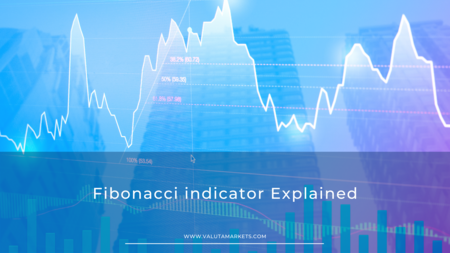
The Fibonacci indicator
You can use a Fibonacci indicator to show a stock price’s support and resistance level. Although retracements and moving averages are alike in this respect, the former is determined by the extent of a previous bearish or bullish run. Additionally, retracements don’t change daily in the current trend like moving averages.
Thanks to this, it can be much easier to anticipate and identify support and resistance levels when using Fibonacci sequences. Fibonacci retracements are essentially a set of ratios, and the Fibonacci sequence determines them.
How do Fibonacci ratios work?
Before understanding why specific ratios are chosen, it is essential to look at the Fibonacci number series.
The Fibonacci numbers sequence is: 0, 1, 1, 2, 3, 5, 8, 13, 21, 34, 55, 89, 144, etc. Every single term in the sequence is obtained by simply summing up the two preceding terms. It continues infinitely. Among the most impressive features of this numerical series is that each number is about 1.618 greater than its predecessor. This recurrent relationship between numbers forms the basis of the ratios that technical traders use to deduce retracement levels.
The central Fibonacci ratio, 61.8%, is obtained by dividing a single number in the sequence by the number after it. For instance, you get 0.61798 by dividing 55 by 89. You also get 0.6176 by dividing 21 by 34.
To discover the 38.2%, you should divide a number in the sequence by another one located two spots to its right. For example, when you divide 55 by 144, you get approximately 0.38194.
Lastly, you obtain the 23.6% ratio by dividing a single number in the series by the one that is three places to its right. For instance, you’ll get 0.23529 when you divide 8 by 34.
The Golden Ratio
The golden ratio, also known as the golden mean, is an irrational number approximating to 1.618. It is represented by the Greek letter phi (ϕ). This ratio is derived when the ratio of two numbers is identical to the ratio of their sum to the larger of these two numbers.
In simple terms, you get the golden ratio by dividing a line segment into two smaller ones with varying lengths. The whole line segment’s ratio to the longer segment equals the longer segment’s ratio to the shorter segment.
Calculating the golden ratio
The calculation used to obtain the golden ratio is:
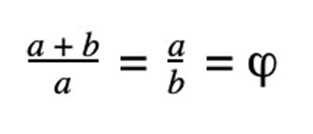
Where: a > b > 0
The Greek letter phi (ϕ) in the equation represents the golden ratio.
Numerically, the golden ratio is expressed as:
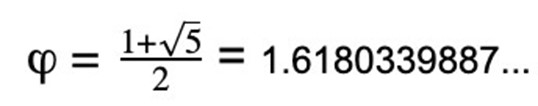
Because (ϕ) is irrational, digits appearing after the decimal point continue forever without repetition.
The Fibonacci sequence and the golden ratio
The golden ratio is closely tied to the Fibonacci number sequence. This is because, as the Fibonacci number increases, the ratio from two consecutive numbers in the sequence continues to become closer to the golden ratio.
Cons of the Fibonacci indicator
Despite the popularity of the Fibonacci indicator, it bears some technical and conceptual limitations that you should keep in mind when using them to trade.
The most significant issues are:
- The use of the Fibonacci indicator is subjective; therefore, traders who use it unsuccessfully attribute their losses to its unreliability. Others scrutinize it solely for being a technical analysis tool. It is necessary to note that those that use it successfully don’t usually share similar views to the traders that make losses.
- Every Fibonacci tool is based on a numerical anomaly that isn’t founded in any rational proof.
- This strategy can only pinpoint possible reversals, countertrend bounces, or corrections. Therefore, it struggles to substantiate other indicators and is unable to identify weak and strong signals quickly.
Take away
You can use the Fibonacci indicator as a risk management tool which will help you to gauge your risk/reward ratio before you initiate any trade. Also, consider using it to reveal new support and resistance levels actively.